iMScope TRIO
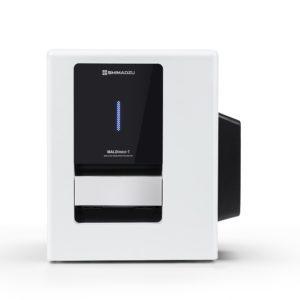
Визуализирующий масс-микроскоп iMScope TRIO — уникальный инструмент молекулярной визуализации методом масс-спектрометрии MALDI.
- Описание
- Resolution
- Analysis
- Industrial fields
- Software
Описание
iMScope TRIO представляет собой комбинацию оптического микроскопа, гибридного масс-спектрометра и системы ионизации при атмосферном давлении MALDI/LDI. Благодаря этому, в ходе одного исследования можно получить и совместить три принципиально разных изображения образца: оптическое (в проходящем/отраженном
свете), флуоресцентное, а также полученное путем обработки результатов масс-спектрометрического анализа.
Программное обеспечение Imaging MS Solution позволяет накладывать изображение распределения множества целевых соединений, полученное с использованием ионизации MALDI и масс-спектрометра, на изображение, полученное при помощи встроенного оптического микроскопа. При этом уровень пространственного разрешения МС-изображения является наивысшим на сегодняшний день и составляет всего 5 мкм.
Это обеспечивает возможность детального анализа представляющих интерес областей тканей, например проведения сравнительного анализа здоровой и пораженной опухолью областей ткани или наблюдения за распределением и трансформацией противораковых лекарственных препаратов в организме.
Наряду с высокой точностью масс-спектрометрической визуализации iMScope TRIO обеспечивает расширенные возможности качественного структурного анализа за счет возможностей гибридного масс-спектрометра проводить масс-спектрометрические измерения в режиме МСn (n ≤ 10), что позволяет исследовать структуру наблюдаемых целевых соединений.
Resolution
High Spatial Resolution
* Sales area: All areas excluding North America
High-resolution imaging offered by optical microscopes is required not only for pharmacokinetic analysis, but also for toxicity testing and toxicity mechanism analysis. Analysis of the retina and skin requires imaging with high spatial resolution.
High spatial resolution imaging of mouse skin
In this experiment, the fat in rat skin was visualized. High spatial resolution imaging clearly showed localization of ceramide in the horny layer and phosphatidylcholine (PC) in the sebaceous gland.
Visualization of Lipid in a Mouse Cerebellum
A wide variety of molecules relate to diseases states. Imaging mass spectrometry using the iMScope TRIO can detect a wide range of molecules within a defined mass range. Therefore, distribution information for several target molecules with different molecular weights can be determined simultaneously during a single measurement. Visualization Profiling.
By displaying the signal intensity at molecular weight of each target molecule, the 2D location of the target molecules is visualized. All target molecules can be detected simultaneously by a single measurement. Furthermore, samples are measured at a fast 6 pixels per second*, dramatically shortening your experiment time. In this example, the distribution of phosphatidylcholines (PCs) in the mouse cerebellum was successfully visualized within 3 hours (2.5 mm square). Limitations in immunostaining of lipids have previously made visual mapping of these compounds difficult. However this can easily be achieved using the iMScope TRIO, making this technology very powerful, particularly in areas such as brain function analysis and any biological process where lipids are known to play an important role.
High Spatial Resolution Imaging of Mouse Retina
High-resolution imaging offered by optical microscopes is required not only for pharmacokinetic analysis, but also for toxicity testing and toxicity mechanism analysis. Also, evaluating the phototoxic property of drug candidates requires detailed analysis of the retina and neighboring organs.
In this experiment, two types of phosphatidylcholine (PC) distributions in the mouse retina were visualized. The PC (18:0/22:6) located next to the retinal pigment epithelium, which is about 10 μm thick, and the PC (16:0/18:1) located toward the outside the epithelium, can be detected and visualized distinctively. The images show that the two types of PC are distributed in thin layered structures.
For Research Use Only. Not for use in diagnostic procedures.
This page may contain references to products that are not available in your country.
Please contact us to check the availability of these products in your country.
Overlaying
Overlaying Optical and MS Images
* Sales area: All areas excluding North America
Overlaying MS images and optical microscope morphological images reveals the difference between the amounts of
specific molecules in each minute organ and can relate molecular distribution to the biological functions of an organelle and morphological changes.
For Research Use Only. Not for use in diagnostic procedures.
This page may contain references to products that are not available in your country.
Please contact us to check the availability of these products in your country.
Analysis
High-speed analysis
* Sales area: All areas excluding North America
Seminolipids in mouse testis
Furthermore, samples are measured at a fast 6 pixels per second*, dramatically shortening your experiment time. In this example, the distribution of seminolipids in the mouse testis was successfully visualized within 3 hours (2.5 mm square).
*Ionization time: 50 ms,
mass range: m/z 500–1000, MS mode
The images show characteristic distributions of seminolipids (m/z 795.5 and 809.5) and phosphatidylinositols (m/z 885.5) in mouse testis. In this example, 9-aminoacridine was vapor-deposited as a matrix on the sample, and mass spectra were measured in negative ion mode. Negative ion spectra are simpler than positive ion, making it easier to identify target molecules. Negative ion analysis is frequently used for low molecular weight metabolite analysis.
For Research Use Only. Not for use in diagnostic procedures.
This page may contain references to products that are not available in your country.
Please contact us to check the availability of these products in your country.
Pharmacokinetic Analysis
* Sales area: All areas excluding North America
In pharmacokinetic analysis, the iMScope TRIO enables the distribution of unchanged and metabolized drugs to be simultaneously mapped in a single measurement, without any labeling. The laser diameter used during mass spectrometry imaging with the iMScope TRIO is continuously variable from 5 to 200 μm, offering low to high spatial resolution. This helps ensure that analyses are performed as efficiently as possible.
Pharmacokinetic analysis of mouse with olaparib administered
Using a mouse administered with olaparib, the pharmacokinetic status of the tumor was visualized. In this way, imaging mass spectrometry is being utilized even in the clinical trial phase of drug discovery, rather than only during basic research.
Pharmacokinetic analysis of mouse with paclitaxel/micellar paclitaxel administered
This shows that micellation of the known anticancer agent paclitaxel improves its retention within the tumor. Consequently, imaging mass spectrometry is being utilized for DDS research as well.
Samples provided by the Division of Developmental Therapeutics, Research Center for Innovative Oncology, National Cancer Center Hospital East
For Research Use Only. Not for use in diagnostic procedures.
This page may contain references to products that are not available in your country.
Please contact us to check the availability of these products in your country.
Structural analysis by highly accurate MSn analysis
* Sales area: All areas excluding North America
Visualize the molecular distribution (multiplexed imaging)
MS and MS/MS Imaging
Even if a molecule cannot be identified in the MS spectra, due to multiple molecules coexisting at the same mass (peak), these can be distinguished and visualized (rendered to images) by MS/MS analysis.
For Research Use Only. Not for use in diagnostic procedures.
This page may contain references to products that are not available in your country.
Please contact us to check the availability of these products in your country.
Industrial fields
* Sales area: All areas excluding North America
In industrial fields, various surface inspection technologies are widely used to ensure stable production of high quality products. Imaging mass spectrometry is capable of analyzing various contaminants that cannot be detected by conventional surface inspection methods, and it is possible to gain new knowledge for higher quality production.
For Research Use Only. Not for use in diagnostic procedures.
This page may contain references to products that are not available in your country.
Please contact us to check the availability of these products in your country.
Software
Imaging Mass Solution Ver.1.1 (Software)
Wide variety of statistical analysis functions and user-friendliness
1. Statistical analysis function for imaging
Statisical Analysis
Statistical analysis allows to extract unique distribution of molecules easily. m/z image can be directly selected not only from spectrum but also from statistical analysis easily.
PCA analysis
PCA organizes all detected peaks (m/z values) based on loading factor (weight coefficients assigned to individual peaks). When the peaks are arranged in an array, the MS images can form several patterns representing principal components. Therefore, PCA can be especially useful for finding ions that show specific localizations. This feature helps provide more multifaceted data analysis.
ROI analysis
ROI analysis helps investigate and compare substances in two specified regions of interest (regions A and B, in the example above) to determine which substances are increased or decreased in each region. For example, if the amount of a given molecule increases in a cancerous region, then that is treated as a candidate cancer biomarker.
HCA analysis
HCA (Hierarchical Cluster Analysis) creates clusters (groups) consisting of similar substances from the mixture of different characteristic molecules and classifies target substances from distribution information. Even in case target substances are determined previously, other substances of similar distribution can be shown.
2. Simple comparison analysis functions
Data edition
Combine and normalize multiple data for comparative analysis Enable to handle with more than prescribed number of sample points (Over 250 points on each side) Using ROI analysis function, comparative analysis between two different analytical results acquired previously is possible, which allows to find out the difference generated under the specific analytical conditions.
3. Available in compatible format
Data conversion
Compatible to imzML, Analyze format after conversion to imd.format. Convert data from profile (spectrum and local position) of AXIMA and MALDI-7090 and optical images, to new format available to read in Imaging MS software. Note: The above systems have upper limits of the database size. Use data edition software to reduce the size if it exceeds the limit.
Display
Selecting Peaks and indicating m/z image are smoothly moved from statistical analysis. On m/z image display, multiple m/z images can be overlaid.
This product is the achievement of the program “Development of System and Technology for Advanced Measurement and Analysis” by Japan Science and Technology Agency.
For Research Use Only. Not for use in diagnostic procedures.
This page may contain references to products that are not available in your country.
Please contact us to check the availability of these products in your country.


