GCMSsolution
Workstation Software for GCMS-QP2010 Series
- Описание
- Adjustment
- Support
- Analysis
- Transition
Описание
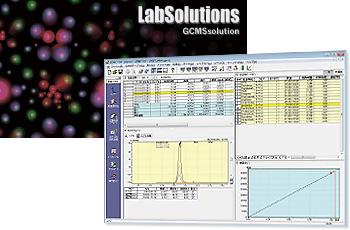
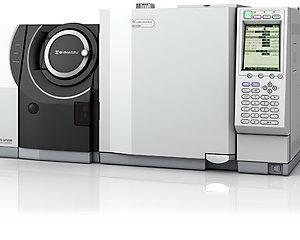
GCMSsolution is the workstation software for Shimadzu GCMS-QP2010 series gas chromatograph mass spectrometers. It features a user-friendly interface that allows intuitive operation while an ample collection of Wizard functions assists in entering parameters. This ensures that even first-time users can navigate operations. In addition, GCMSsolution offers a generous array of features, such as an automatic retention time adjustment function, outstanding ease-of-operation that allows identifying multiple components more efficiently, and a report creation function that offers a high degree of freedom in formatting reports.
This page may contain references to products that are not available in your country.
Please contact us to check the availability of these products in your country.
Газовые хроматомасс-спектрометры SHIMADZU: объекты анализа, выполняемые ГОСТы
Adjustment
Automatic Adjustment of Retention Time Function (AART)
AART
The AART function adjusts the retention times of target components based on linear retention indices (LRI) and the retention times of n-alkanes. The AART function easily adjusts acquisition and processing method parameters simultaneously.
Creation of Automatic Scan/SIM Table COAST
FASST (Fast Automated Scan/SIM Type) is a data acquisition technique used to perform high-sensitivity measurement while retaining qualitative information of the mass spectrum for the compounds for which enough sensitivity cannot be obtained in scan mode. COAST (Creation of Automatic Scan/SIM Table) automatically creates a method file in FASST mode using measurement data from scan mode. By selecting compounds to be measured in FASST mode, a method file is automatically created and easily transferred for FASST analysis using registered analysis parameters. Fine-tuning of the measurement group time is easily possible by clicking on the chromatogram.
For Research Use Only. Not for use in diagnostic procedures.
This page may contain references to products that are not available in your country.
Please contact us to check the availability of these products in your country.
Support
Extensive support for creating MRM methods
Creation of Automatic Scan/SIM Table (COAST)
Smart MRM makes method development quick and easy. Whether starting from scratch to optimize transitions and collision energies for new compounds, or starting from an MRM database of known target analytes to build a custom MRM method, Smart MRM takes the stress an difficulty out of method development.
Compounds and Optimized Transitions -Smart Database-
The Shimadzu “Smart Database” is a database of related compounds (e.g. pesticides, drugs, metabolites, etc.) with optimized transitions and collision energies, CAS registry numbers, and Retention Indices (RI) . The user can select from hundreds of pre-registered compounds in one of the “Smart Database” files, or add their own optimized transitions. The user selects the compounds to be analyzed, and Smart MRM builds the MRM or Scan/MRM acquisition method from the “Smart Database” with the push of a button.
Automatic Method Creation -Smart MRM-
Shimadzu’s Smart MRM technology creates MRM and Scan/MRM methods by automatically adjusting the analytical dwell times for each transition in a method. For multi-component analyses, with hundreds of compounds and up to 32,768 transitions, adjusting the loop and dwell times for optimum sensitivity can be complex and difficult.
Optimize MRM Transitions Automatically -MRM Optimization Tool-
Determining and optimizing MRM transitions for new compounds can require significant development time. The “MRM Optimization Tool“ automates the process by collecting product ion scan data and finding the optimum collision energy for each transition. Once established, the transitions are registered to one of the Shimadzu “Smart Database” files, and the MRM or Scan/MRM methods are created using Smart MRM.
For Research Use Only. Not for use in diagnostic procedures.
This page may contain references to products that are not available in your country.
Please contact us to check the availability of these products in your country.
Analysis
Makes possible virtually effortless analysis of data
Quantitation Browser
The quantitation browser allows the user to review multiple data sets in the same window. This allows checking the chromatograms and quantitation results from multiple samples with minimal switching between windows.
Supports Accurate Compound Identification
In the analysis of pesticide residues in foods, if the residual level is very low and there is influence from the matrix, peak identification can be difficult. In order to facilitate identification, data from this program can be compared in parallel view with chromatograms obtained at the detection lower limit level and chromatograms of extraction samples with pesticides added. Together, this enables better, easier compound identification. In addition to GC/MS data, data obtained with GC detectors, such as PFDs and ECDs, can also be compared simultaneously.
Similarity Search with Retention Index
Conventional library search, making use of solely spectral similarity, often indicates so many probable candidates for an unknown that it is hard to identify especially in the case that sample includes isomers and much matrix. The GCMSsolution provides «similarity search with retention index», using retention indices registered in the FFNSC GC/MS Library Ver.1.3. This function makes it possible to perform more reliable and easier search even for complex samples. The results can be output as reports in electronic or hardcopy. * The FFNSC GC/MS Library Ver.1.3 can be used for the GCMSsolution Ver 2.4 or higher, or Ver 1.2 su1 or higher. The GCMSsolution Ver 2.4 or higher is required in order to use similarity search with retention index.
Highly Flexible Report Customization
The report format can be edited output into a blank report window sizes. Build your own custom report by choosing from a wide variety of items including chromatograms, spectra, spectrum search results, and quantitative analysis results. Or choose from a selection of template files for quantitative and qualitative analysis, and once a format has been determined, reports of the same format can be created simply by specifying the report file name.
Macros for Reports
Macro functions that facilitate the display of required information on reports make it possible to produce a more diverse range of information. They can be used simply by pasting variables for items of information displayed in the help window into the property dialog boxes of report items.
For Research Use Only. Not for use in diagnostic procedures.
This page may contain references to products that are not available in your country.
Please contact us to check the availability of these products in your country.
Transition
Transition from GC-MS to GC-MS/MS is also smooth
GC-MS methods can also be used for GC-MS/MS
Methods created for the QP2010 series can also be used with the TQ series. This means that GC-MS/MS analysis can be carried out using existing methods when transitioning from the QP2010 series to the TQ series. This results in a great reduction in the number of working hours needed for the transition, since there is no need for redoing the settings for the GC conditions or the analysis parameters. Moreover, equivalent scan spectra can be obtained from the QP2010 series and the TQ series, so existing mass spectral libraries can be used for both QP2010 and the TQ series.
Similarity of software procedures results in lower training costs
Data acquisition and analysis can be carried out within an operating environment that is common to both GC-MS and GC-MS/MS. The operator does not need to learn new procedures, so training costs are reduced.
For Research Use Only. Not for use in diagnostic procedures.
This page may contain references to products that are not available in your country.
Please contact us to check the availability of these products in your country.


